Assessing the Transit Efficiency of the EDSA Busway
- Lester Jay Ollero
- Oct 3, 2025
- 6 min read

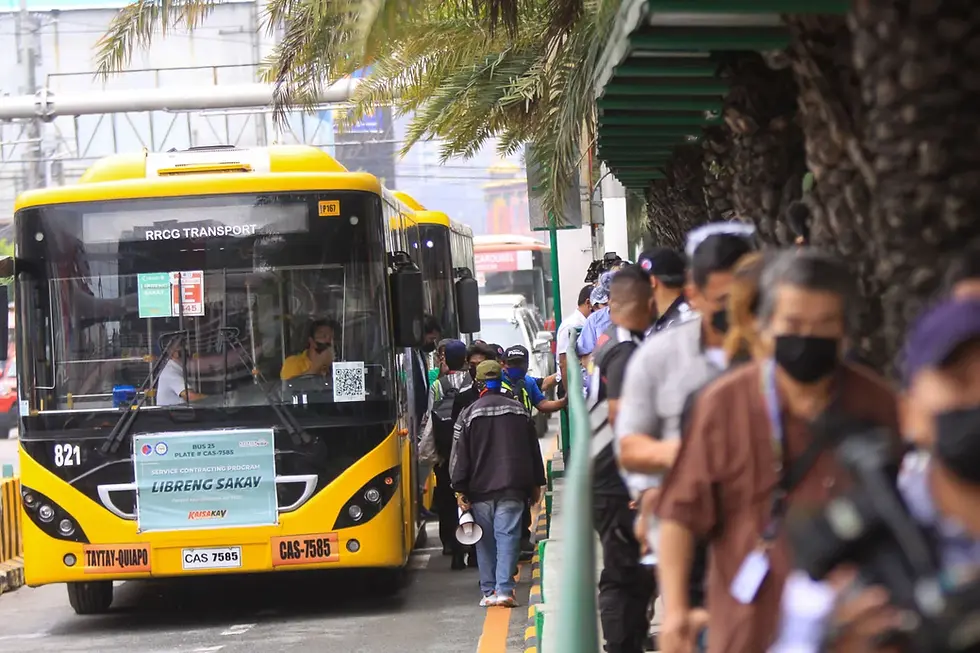
The establishment of an exclusive bus lane along EDSA has been one of Metro Manila’s most significant public transport reforms in recent years. It was prompted by the opportunity to restructure the bus system in response to the COVID-19 pandemic in the Philippines and forms part of the broader initiative to modernize the existing public transportation network. But beyond the infrastructure itself, rigorous analysis of its operations, through real-time data and simulation tools, has been key to understanding its impacts on travel time, system efficiency, and environmental sustainability.
In a study conducted by members of SafeTravelPH (Ollero et. al, 2024), they developed a microsimulation model of the EDSA Busway that not only captured operational realities but also provides insights into fuel efficiency and environmental performance. Using a combination of crowdsourced data through SafeTravelPH app and microsimulation software (AIMSUN), the methodology proved to be reliable, scalable, and high applicable to other routes under the Public Transport Modernization Program (PTMP). Data Collection with the SafeTravelPH App
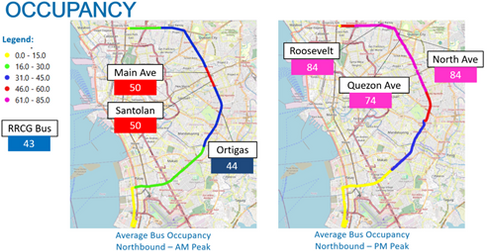
The mobile application was utilized to collect the passenger and bus operational data through boarding and alighting surveys. The use of mobile app was employed to capture boarding and alighting events, average operating speed, distance traveled, and dwell times at each stop.

On-Board Diagnostics (OBD) Device
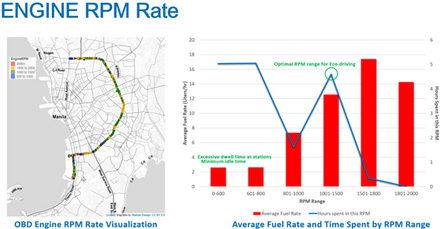
The On-Board Diagnostics (OBD) device was also utilized in the study to collect data from buses operating along the EDSA Busway. The device served as the tracking unit, enabling real-time monitoring of various bus parameters. During the survey period, the OBD device recorded bus parameters such as acceleration, distance traveled, engine fuel rate, vehicle speed, and engine RPM, providing significant insights into bus performance and operational efficiency.

Results from the Survey


Microsimulation Modelling
The traffic simulation tool, AIMSUN, was utilized in the study to simulate scenarios aimed at improving the EDSA Busway busway performance. The baseline model's base map was derived from OpenStreetMap (OSM) files to generate the roadway network and precise locations of the EDSA Carousel stops were mapped using GPS coordinates collected during the survey.

Model Calibration and Data Validation
The model underwent iterative calibration and validation against the Geoffrey E. Havers (GEH) statistic and the Root-Mean Square Error (RMSE) to assess the discrepancies between the observed and modeled data. GEH statistic requires to have a value of below five (5) for at least 85% of the individual turn flows to be considered as good fit.

Root Mean Square Error (RMSE) was also used to evaluate the accuracy of a simulation model by comparing the simulated bus speeds to the actual bus speeds. The calibration parameters, with four experiments varying the maximum desired speed was considered. The model underwent several iterations, refining bus flow and speed while re-evaluating RMSE until values fall within acceptable ranges. The observed vs modeled maximum desired speed used in the model is shown below.

Scenario Evaluation A comprehensive set of transport and traffic measures were proposed to investigate potential enhancements to the operational efficiency of the EDSA Busway. The proposed scenarios encompass modifications to bus dwell times and infrastructure improvements.
Base Case Scenario
The initial scenario modeled in AIMSUN represents the existing traffic conditions along the EDSA Busway.
Scenario 1 - Bus Dwell Time Regulation
A maximum duration of 30 seconds has been established for passenger boarding and alighting per bus unit at the EDSA Busway. However, field observations indicate inconsistent compliance with this regulation. To address this, Scenario 1 involves the strict enforcement of the 30-second dwell time limit to ensure adherence across all bus operations.
Scenario 2 - Optimal Dwell Time of 60 seconds
To determine the optimal dwell time, 461 data points from the boarding and alighting data were analyzed, plotting them to identify the best-fit line.

These results show that using the average of the linear regression could be a good way of scheduling bus dwell times. The average dwell time of the linear regression is found to be 60 seconds.
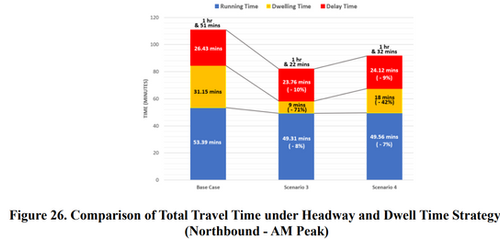
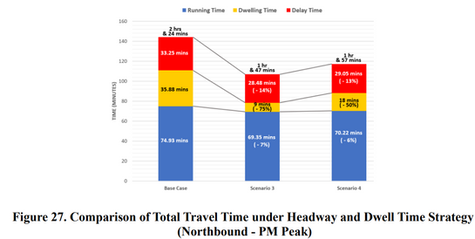
Scenario 3 - Headway Strategy + 30-second dwell time limit Bus arrivals and headways during the survey period were highly unpredictable. The average bus headway was 65 seconds for the northbound direction and 62 seconds for the southbound direction. However, the interval between buses can extend up to 17 minutes to 26 minutes. This resulted in extended passenger waiting times and long queues of commuters Therefore, Scenario 3 incorporates the headway strategy along with the 30-second dwell time limit.
Scenario 4 - Headway Strategy + 60-second dwell time limit Scenario 4 incorporates the headway strategy outlined in Scenario 3, but with a modification to the bus dwell time at stations along the EDSA Busway. Instead of the 30-second dwell time, a 60-second optimal dwell time will be implemented
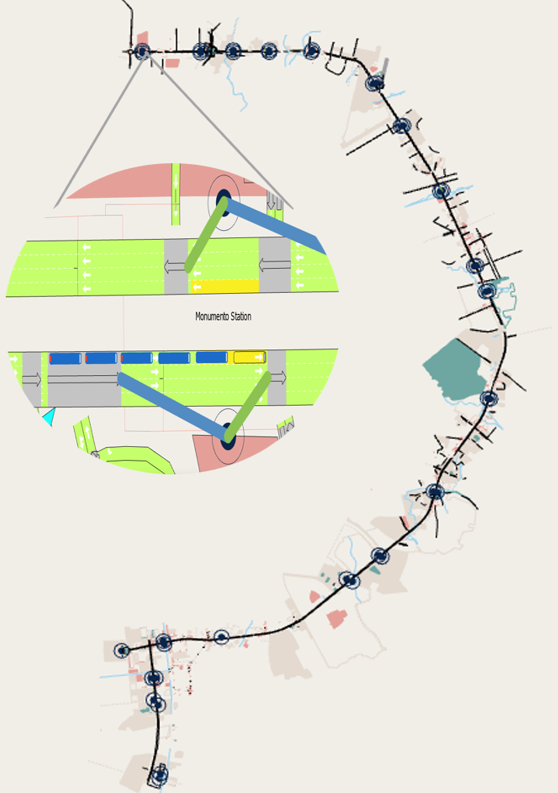
Scenario 5 - Provision of Passing Lanes, Headway Strategy, 30-second dwell time limit Scenario 5 includes the provision of passing lane for buses as shown in the sample station below. The ability to overtake enables more buses to operate on the same route simultaneously without causing congestion, minimizing delays, and increasing the service frequency. Along with the overtaking lanes, Scenario 5 will also incorporate a 60-second headway strategy and a 30-second bus dwell time.

Passing Lanes for Buses Scenario 6 - Provision of Passing Lanes, Headway Strategy, 30-second dwell time limit
Comparison of the Corridor Performance of the Different Scenarios
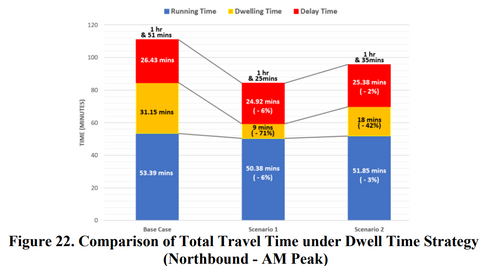
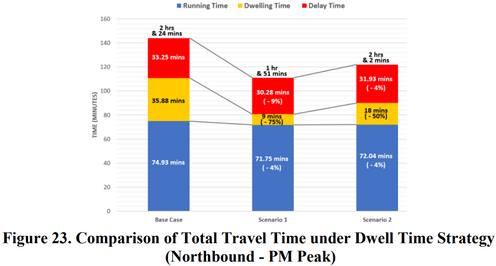
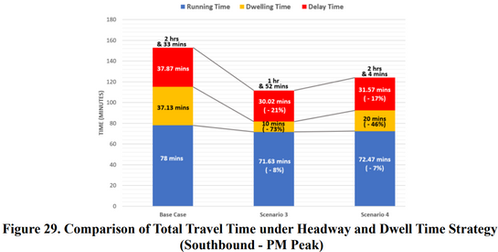
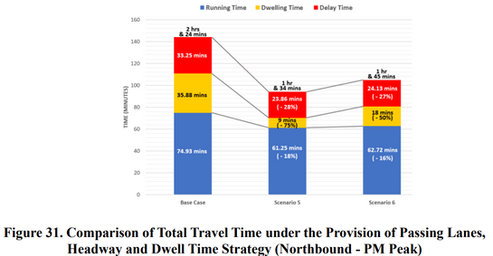
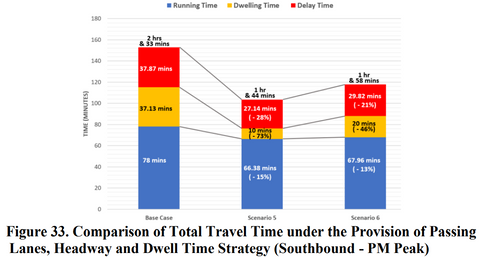
The succeeding figures provide a comparison of total travel times across different scenarios, which include running time, dwell times, and delay times. Running time refers to the duration taken for a bus to complete a round trip from PITX to Monumento and vice versa, excluding dwell and delay times. Dwell time indicates the period during which a bus remains stationary at a specific transit stop for passengers to board and alight. Delay time encompasses various factors, such as time spent at dispatching areas like Monumento and PITX, buses navigating through traffic (especially in segments lacking dedicated bus lanes), negotiating areas with conflicting U-turn slots, interactions between buses, and delays caused by government emergency vehicles utilizing dedicated lanes for buses. Each scenario shows a percentage decrease in both AM and PM peak periods, highlighting how certain interventions (represented by the scenarios) can significantly improve travel time, dwell times, and delay times during peak times.
Comparison of the Total Travel Times under Dwell Time Strategy


Comparison of the Total Travel Times under Headway and Dwell Time Strategy


Comparison of the Total Travel Times under Provision of Passing Lanes, Headway, Dwell Time Strategy


In the Base Scenario, the total travel time from PITX to Monumento is 1 hour and 51 minutes during the AM peak and 2 hours and 24 minutes during the PM peak. With the provision of passing lanes, improved headway management, and dwell time strategies, the total travel time is reduced to 1 hour and 16 minutes during the AM peak and 1 hour and 34 minutes during the PM peak.
Total Travel Time Reduction from PITX to Monumento
Period | Base Travel Time | With Strategy | Reduction (min) | % Reduction |
AM Peak | 1h 51m | 1h 16m | 35 min | 31.5% |
PM Peak | 2h 24m | 1h 34m | 50 min | 34.7% |
For the southbound direction (Monumento to PITX), the Base Scenario travel time is 2 hours and 22 minutes during the AM peak and 2 hours and 33 minutes during the PM peak. With the same strategies, the travel time is reduced to 1 hour and 29 minutes during the AM peak and 1 hour and 44 minutes during the PM peak.
Total Travel Time Reduction from Monumento to PITX
Period | Base Travel Time | With Strategy | Reduction (min) | % Reduction |
AM Peak | 2h 22m | 1h 29m | 53 min | 37.3% |
PM Peak | 2h 33m | 1h 44m | 49 min | 32.0% |
Data Advocates for Increased Dedicated Resources for Commuters
This important analysis of the EDSA Busway, supported by real-time data and advanced microsimulation, clearly demonstrates the significant potential for improving urban public transport. By implementing strategic interventions such as optimal dwell times, headway management, and infrastructure enhancements like passing lanes, travel times can be drastically reduced, leading to a more efficient, reliable, and sustainable bus system for Metro Manila. These findings underscore the importance of data-driven approaches and continuous public investments in our public transportation networks and infrastructure, ultimately benefiting commuters and urban mobility as a whole.